Next game up will be round 20 (getting pumped by the Warriors).
I'm half way through that one and noticed a big disparity in possession between a couple of players (Wilton and Graham) so I want to take the opportunity to demonstrate how much possession can vary between two players in the same game - again to reinforce the point that relying on "runs" or "metres" is an awful way to evaluate player performance.
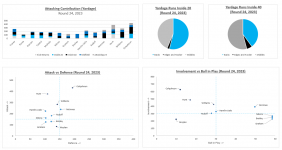
Here are the games I've modelled so far, with team possession in blue, and then the highest and lowest possession players. There are some games where it is fairly close (Storm Rd15) and in general it doesn't vary more than 8-10% - but there is some wild variance in Rd 16 and Rd 20 (first half).

Here is a really simple graph which shows how many extra tackles a team will make as the opposition possession rate goes up. This is very easy way to show that having the ball more than the other guys is the key to winning attacking volume stats (metres, runs, kick metres....blah blah blah).

Looking at that 23% difference in the first half in round 20 between the lowest player (Graham) and the highest player (Wilton) with comparable ball in play time Wilton was on the field for ~20 more play the balls in possession, and ~20 play the balls less in defence. That's 3-4 sets of six in defence... or conversely 15-20 more opportunities to take a hit-up
while also having to defend for 3-4 sets less.
Using that particular half of footy might be an outlier though, so let's use a game where the
team possession was close to 50% and the high and low players played similar minutes but still had a noticeable difference. Let's go with Finucane (37 minutes @ 42%) v McInnes (39 minutes @52% against Manly in Rd 21 (team possession 49%).
Isolating these two players tells me that purely from a
metres point of view McInnes crushed Finucane (~double the running metres). The Ch9 commentary team and your favourite dipshit podcasters will tell you here that Finucane is getting too old and should be moved on or play less minutes....

However, there was a 10% possession rate difference between these two players, and they played very similar minutes (37 minutes BIP for Finucane, 39 for McInnes).
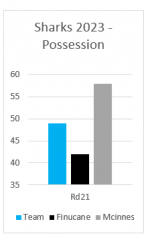
If we re-adjust that simple "extra tackles" graph to 38 minutes of ball in play rather than 80 minutes of game time, the magic number here is 46. This means that Cameron McInnes had to defend for ~46 tackles less than and got to attack for ~46 tackles more than Dale Finucane. This is huge in the context of the players' individual statistical output.
Even in "normal" circumstances a 10% difference in possession can be huge in terms of how it effects "volume stats" like metres, runs and tackles.

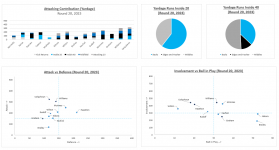
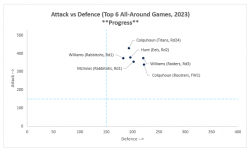
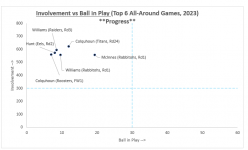
Looking at how these two players compare in the model, we see that adjusted for possession their attacking output was very comparable, but Mcinnes was a little busier in defence (which is understandable given the reduced overall defensive load).

I do understand that in this thread I am somewhat "preaching to the choir" to a certain extent (the posters who will bother to read it probably already get it) but this is still very solid and useful data, and I feel it definitely adds further weight to the argument that volume stats for Rugby League tell you very little other than that 1) the player has a motor and 2) the coach trusts him to be out there more than some other guys.
One final thought here is that once I have all of the games done I can look at which games the combined forward involvement was best, and also do a comparison of 4 forward bench vs 3 forward bench etc.
Enjoy!


