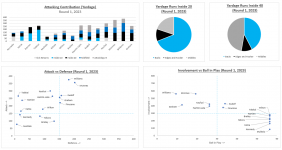
Fancy Stats for 2023

BurgoShark

Super Moderator
Joined
Apr 8, 2008
Messages
12,868
Reaction score
4,097
I've done some more work refining my model for player involvement so that reflects where runs take place rather than just how many metres they ran. I've also had some discussions with members about incorporating other parts of players' games into the model. I've now done that. There is now a very small weighting for positive and negative plays both in attack and defence.

Note that this model uses the nrl.com stats for "tackles" and "missed tackle" but no other stats sources is used. Everything except tackles is captured by me.

As an off-season project, I'm going to start with round 1 and work my way through the season. I've also tried to boil everything within the game down to something that could be shown in one graphic. I'll add final details for each player once done.

To start, I thought it might be useful to provide a guide for how to read/interpret the information.

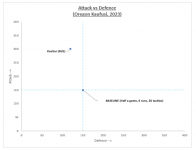
I'm going to use Oregon Kaufusi's Round 1 performance to demonstrate.

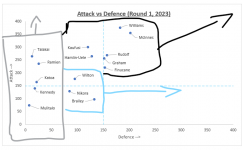
Attack vs Defence
This maps a player's attacking involvement against their defensive involvement.
* Closer to the top = more work running the ball
* Closer to the right = more tackling

The lines at 150 are a guide to represent a baseline for what you might expect from a middle-of-the-road bench forward in a game where the possession is 50/50.
* 150 in attack = half a game, 6 runs outside your own 40, no errors
* 150 in defence = half a game, 26 tackle, 0 misses

Anything more a player does will make one of his scores go up. Any errors, missed tackles, etc. will make one of his scores go down.

His round 1 graph shows us that compared to the 150+150 baseline, he was heavily involved in attack, with an OK level of involvement in defence.
1694641584893.png


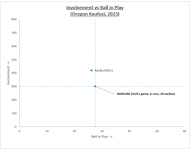
Involvement vs Ball in Play
This maps a player's total involvement (attack plus defence score above) against their minutes. I've used "Ball in Play" here, because it is much more meaningful than "minutes", especially for low-minute players. There is ~55 minutes of Ball in Play in an NRL game, so 27.5 minutes is "half a game".

Again we have our baseline here.
* 150 attack + 150 defence = 300
* 27.5 minutes of ball in play.

This gives us some context around player usage vs their involvement. i.e. the Royce Hunt effect. If a player is going full noise for 20 minutes it is expected that they would be more heavily involved than a player who is out there for 50.

Again we see that Kaufusi in this game had a decent level of involvement, which he maintained for close to half a game.
1694642061943.png

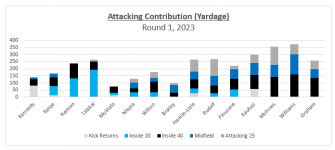
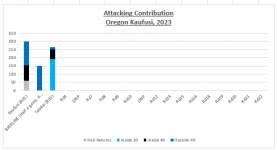
Attacking Contribution
This one shows us how the player achieved their attacking score.

Kaufusi's attacking score was 300.
* 50 from kick returns
* 0 from runs inside his own 20
* 100 from runs inside his own 40
* 150 from runs outside his own 40

This gives us an idea of where and how he is contributing to gaining a yardage. Is he waiting at the 40m line for the backs to get to him, is he taking carries, is he getting his numbers pumped up by taking a bunch of kick returns, etc.? I've temporarily added Talakai in to this one to show the difference in the nature of how and where players contribute on yardage.

Also a note here... for forwards I am tracking all runs, but for backs I am only tracking yardage runs.

All in all for this game, this is a reasonable contribution from Kaufusi. Better than the baseline, and comparable overall to the work rate of the best metre-eating outside back.

1694642891204.png

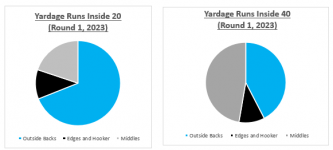
Yardage Runs Pie Charts
This one is a cumulative version of the above, for all players combined. This tells us who is taking the runs in areas of the field.

Below we can see that for the whole team in this game, close to 3/4 of the runs from inside their own 20m line were from outside backs, and that once they got outside the 20 we saw a lot more involvement from the middles.

* The chart on the left is runs that start inside the 20m line.
* Note that the one on the right is runs that start on or outside the 20m line, but inside the 40m line.
1694643670686.png


I'll post Round 1 now :)
 

Tatus

Not-So-Great White
Joined
Jan 18, 2011
Messages
10,113
Reaction score
789
Location
South Coast
I like this. Like you said, it helps show how a player is being used. You’ve shown inside our own 20, reckon you could show inside opponents 20 too?
 

Sparkles

Jaws
Joined
May 21, 2008
Messages
12,077
Reaction score
2,816
Just thinking about how I can use this for supercoach next year... ;)

Could you say identify trending rises in involvement over a few weeks? Spot a player on the up (maybe a rookie) who could be looking at breaking out?

Maybe predict roughly when a player returning from injury is likely to hit their optimal performance again based on increases in involvement? Or see from the data how long that usually takes by position or other relevant criteria that affects the timeline?

It'd be interesting to see in the stats things like how different players involvement changes based if a half being injured or replaced. For example, does Ramien get less ball on his side with Trindall in the team? Or Talakai more with Moylan? You coudl figure some of this stuff out but it'd be pretty laborious by hand and impossible with halves moving clubs... would be great to know that if say Tracey came in at 6 how that would likely affect the involvement of other players based on his history in the role.

Too much? :D
 

BurgoShark

Super Moderator
Joined
Apr 8, 2008
Messages
12,868
Reaction score
4,097
Just thinking about how I can use this for supercoach next year... ;)

Could you say identify trending rises in involvement over a few weeks? Spot a player on the up (maybe a rookie) who could be looking at breaking out?

Maybe predict roughly when a player returning from injury is likely to hit their optimal performance again based on increases in involvement? Or see from the data how long that usually takes by position or other relevant criteria that affects the timeline?

It'd be interesting to see in the stats things like how different players involvement changes based if a half being injured or replaced. For example, does Ramien get less ball on his side with Trindall in the team? Or Talakai more with Moylan? You coudl figure some of this stuff out but it'd be pretty laborious by hand and impossible with halves moving clubs... would be great to know that if say Tracey came in at 6 how that would likely affect the involvement of other players based on his history in the role.

Too much? :D
Haha maybe.

If I was tracking this week to week it might be useful. I'm not sure how much it helps you in the off-season though.

The bolded bits you could probably garner some useful information for. i.e. when a player comes back from injury, how many weeks before Fitz puts them back into their normal role/minutes etc.

FWIW having tracked and refined this model across four seasons now, I actually know a lot of this stuff already around usage of middles. Every time we lose a forward I know exactly who is going to take their place and how they are going to be used (90% of the forum still argue with me about it though). I also have very good data for how Fitz will use his rotation in different scenarios. Specifically when one of McInnes/Finucane is missing, when a starting prop is missing, and for a genuine 4-forward bench versus 3 forwards and an extra.

The biggest factor in their fantasy/supercoach score though is going to be possession. Remember that my model adjusts for possession. In this round 1 game Finucane and Rudolf appear close on the graph... but Rudolf was on for 6% less possession that Finucane. Dale actually did more "total work" and would have had a higher SC score, but Toby did more work proportional to how much ball the team had when he was on.

Knowing what I know, I'd go as far as to say that comparing player involvement (metres, tackles, etc.) across games or teams without adjusting for possession is quite useless. You can however compare 80-minute players on the same team and in the same game (since they played under the same conditions). E.g. I can compare the performance of Talakai and Ramien on any day, but unless possession was 50% I can't compare them to the opposition centres, and I can't compare them to their own performances from any other week.

One thing that might change (just a guess at this stage) is that the yardage for other outside backs might go down when Connor Tracey plays fullback, since he takes a lot more yardage carries than Kennedy.

* Keep in mind for outside backs that this is only for yardage carries. It doesn't capture how many times the 6 passed the ball to his centre on a shift, or how effective he was in that situation etc.

I like this. Like you said, it helps show how a player is being used. You’ve shown inside our own 20, reckon you could show inside opponents 20 too?
Hmmm.. why? If you convince me there is a good reason to differentiate between a carry 40m out or 15m out from the opposition try line, I'll look at capturing this and updating the charts.
 
Last edited:

apezza

Great White
Joined
Apr 1, 2010
Messages
4,371
Reaction score
2,118
Note that this model uses the nrl.com stats for "tackles" and "missed tackle" but...

Mate you can't try and hide your laziness behind a "but"!

In all seriousness thanks for taking the time and effort to show all this. It's not everyone's cup of tea but for those of us that like stats for more than Fantasy League this stuff is great.
 
Last edited:

Jaz

Great White
Joined
Nov 18, 2009
Messages
3,940
Reaction score
622
Location
Jannali
@BurgoShark Love your work. Any chance you can summarise your key learnings/insights for those of us more graph-challenged?
 

Sparkles

Jaws
Joined
May 21, 2008
Messages
12,077
Reaction score
2,816
Haha maybe.

If I was tracking this week to week it might be useful. I'm not sure how much it helps you in the off-season though.

The bolded bits you could probably garner some useful information for. i.e. when a player comes back from injury, how many weeks before Fitz puts them back into their normal role/minutes etc.

FWIW having tracked and refined this model across four seasons now, I actually know a lot of this stuff already around usage of middles. Every time we lose a forward I know exactly who is going to take their place and how they are going to be used (90% of the forum still argue with me about it though). I also have very good data for how Fitz will use his rotation in different scenarios. Specifically when one of McInnes/Finucane is missing, when a starting prop is missing, and for a genuine 4-forward bench versus 3 forwards and an extra.

The biggest factor in their fantasy/supercoach score though is going to be possession. Remember that my model adjusts for possession. In this round 1 game Finucane and Rudolf appear close on the graph... but Rudolf was on for 6% less possession that Finucane. Dale actually did more "total work" and would have had a higher SC score, but Toby did more work proportional to how much ball the team had when he was on.

Knowing what I know, I'd go as far as to say that comparing player involvement (metres, tackles, etc.) across games or teams without adjusting for possession is quite useless. You can however compare 80-minute players on the same team and in the same game (since they played under the same conditions). E.g. I can compare the performance of Talakai and Ramien on any day, but unless possession was 50% I can't compare them to the opposition centres, and I can't compare them to their own performances from any other week.

One thing that might change (just a guess at this stage) is that the yardage for other outside backs might go down when Connor Tracey plays fullback, since he takes a lot more yardage carries than Kennedy.

* Keep in mind for outside backs that this is only for yardage carries. It doesn't capture how many times the 6 passed the ball to his centre on a shift, or how effective he was in that situation etc.


Hmmm.. why? If you convince me there is a good reason to differentiate between a carry 40m out or 15m out from the opposition try line, I'll look at capturing this and updating the charts.
Yeah, wasn't sure if you had the data WoW and were at the point of basically plugging the raw data into a sheet that shot out the stats?
Do you have access to that data (for us and other clubs) or is it manually gathered? Monster job is it's manual!

For the Tracey example, I was thinking that he might say have a preference to play the right side and that would direct more of the play that way. Or with Trindall on we go right more. So a Mulitalo might get more point scoring opportunities, that sort of thing.

This is seriously the level of detail my regular SC league gets into... theyre unbelievable!
 

Tatus

Not-So-Great White
Joined
Jan 18, 2011
Messages
10,113
Reaction score
789
Location
South Coast
Haha maybe.

If I was tracking this week to week it might be useful. I'm not sure how much it helps you in the off-season though
The bolded bits you could probably garner some useful information for. i.e. when a player comes back from injury, how many weeks before Fitz puts them back into their normal role/minutes etc.

FWIW having tracked and refined this model across four seasons now, I actually know a lot of this stuff already around usage of middles. Every time we lose a forward I know exactly who is going to take their place and how they are going to be used (90% of the forum still argue with me about it though). I also have very good data for how Fitz will use his rotation in different scenarios. Specifically when one of McInnes/Finucane is missing, when a starting prop is missing, and for a genuine 4-forward bench versus 3 forwards and an extra.

The biggest factor in their fantasy/supercoach score though is going to be possession. Remember that my model adjusts for possession. In this round 1 game Finucane and Rudolf appear close on the graph... but Rudolf was on for 6% less possession that Finucane. Dale actually did more "total work" and would have had a higher SC score, but Toby did more work proportional to how much ball the team had when he was on.

Knowing what I know, I'd go as far as to say that comparing player involvement (metres, tackles, etc.) across games or teams without adjusting for possession is quite useless. You can however compare 80-minute players on the same team and in the same game (since they played under the same conditions). E.g. I can compare the performance of Talakai and Ramien on any day, but unless possession was 50% I can't compare them to the opposition centres, and I can't compare them to their own performances from any other week.

One thing that might change (just a guess at this stage) is that the yardage for other outside backs might go down when Connor Tracey plays fullback, since he takes a lot more yardage carries than Kennedy.

* Keep in mind for outside backs that this is only for yardage carries. It doesn't capture how many times the 6 passed the ball to his centre on a shift, or how effective he was in that situation etc.


Hmmm.. why? If you convince me there is a good reason to differentiate between a carry 40m out or 15m out from the opposition try line, I'll look at capturing this and updating the charts.

Well you have inside our own 20. Wouldn’t that be less valuable when it’s clear our forwards aren’t used there. I reckon a lot more of his runs would be between that 15-40m and less inside their 0-15 but alas, I have no data to prove it, hence why I asked. Also might help show attacking structures when we are in that 15-20m
 

BurgoShark

Super Moderator
Joined
Apr 8, 2008
Messages
12,868
Reaction score
4,097
@BurgoShark Love your work. Any chance you can summarise your key learnings/insights for those of us more graph-challenged?
Cheers.

For the Souths game...

1) Ronnie is less involved than the rest of the back 5.
2) Our centres are hitup machines inside our 20
3) Brailey does more defensive work than any other 80 minute player, and his attacking involvement is just a little under Nikora's.
4) Rudolf and Finucane can both maintain a high involvement in both attack and defence for long minutes.
5) BHU and Kaufusi can maintain the same level of attacking involvement, but for less minutes and with less defensive workload
6) Williams and McInnes are absolute animals when used off the bench in short spurts.

Cheat sheet for this one is to visualise it based on role.
- Backs will be on a corridor on the left. Lots of runs, bugger all tackles. A big game will push them higher.
- Hookers and edge forwards usually won't go very high for runs, but will push more to the right if they have a big defensive game
- Middles you want as close to the top right as possible. Usually lower minute guys will look better

:)

1694658018315.png
 

BurgoShark

Super Moderator
Joined
Apr 8, 2008
Messages
12,868
Reaction score
4,097
Yeah, wasn't sure if you had the data WoW and were at the point of basically plugging the raw data into a sheet that shot out the stats?
Do you have access to that data (for us and other clubs) or is it manually gathered? Monster job is it's manual!

For the Tracey example, I was thinking that he might say have a preference to play the right side and that would direct more of the play that way. Or with Trindall on we go right more. So a Mulitalo might get more point scoring opportunities, that sort of thing.

This is seriously the level of detail my regular SC league gets into... theyre unbelievable!
It's manual. I watch the game and manually record it. That's why I'm going game by game. Probably ~3-4 hours per game.

I would expect that this type of stuff would be part of the analytics the coaches use, so it would exist somewhere. The league pays big bucks for it though.
 

Sparkles

Jaws
Joined
May 21, 2008
Messages
12,077
Reaction score
2,816
It's manual. I watch the game and manually record it. That's why I'm going game by game. Probably ~3-4 hours per game.

I would expect that this type of stuff would be part of the analytics the coaches use, so it would exist somewhere. The league pays big bucks for it though.
Okay, scratch everything I said... :D
 

BurgoShark

Super Moderator
Joined
Apr 8, 2008
Messages
12,868
Reaction score
4,097
Well you have inside our own 20. Wouldn’t that be less valuable when it’s clear our forwards aren’t used there. I reckon a lot more of his runs would be between that 15-40m and less inside their 0-15 but alas, I have no data to prove it, hence why I asked. Also might help show attacking structures when we are in that 15-20m
Which player are you talking about here?

As for measuring runs inside 20, 40 etc. the point is to learn/demonstrate the player usage, including the contribution by non-forwards and the contribution by forwards when they do happen to track back into their own end. Any old plodder can take make metres penalty taps or tackle 3 quick play the balls, but the player who takes the play 3 run 17m from his try-line is a) taking a harder run, and b) giving everybody else extra rest. Usually for the Sharks this will be bench (low minute) forwards. My speculation here is that they are under different instructions than the higher minute guys.

Are you saying that runs around halfway are more or less important then runs inside the opposition 20? Runs and quick ptbs inside the opposition end definitely important, and quick ptb's inside that area is something teams focus on. Are you wanting to learn who the most common players are for the Sharks to use inside 20 for setting up shifts? I'm happy to be convinced. Just not quite sure where your mind is at on this one.
 

BurgoShark

Super Moderator
Joined
Apr 8, 2008
Messages
12,868
Reaction score
4,097
Okay, scratch everything I said... :D
Haha ok.

Once I go through all of the games... you will have one of these graphs for each player round by round. That would definitely be useful.

Sharks forwards rarely score well in fantasy stats because of the way the rotation works. I guess the main piece of advice would be...
* if everyone is healthy and they have a four forward bench, don't pick any Sharks forwards
* if Finucane is out, pick McInnes
* if either Finucane or McInnes are out and they have a 3-forward bench, pick Rudolf
 

Tatus

Not-So-Great White
Joined
Jan 18, 2011
Messages
10,113
Reaction score
789
Location
South Coast
I was talking about the player who you broke down in this thread? (kafusi) I just asked because I’ve been trying to pay attention to who is used where on the field and trying to understand our structures more, breaking it down a little more would only help me in this endeavour. If it’s too much of an ask, all good. My days been too good to carry on over football.
 

BurgoShark

Super Moderator
Joined
Apr 8, 2008
Messages
12,868
Reaction score
4,097
I was talking about the player who you broke down in this thread? (kafusi) I just asked because I’ve been trying to pay attention to who is used where on the field and trying to understand our structures more, breaking it down a little more would only help me in this endeavour. If it’s too much of an ask, all good. My days been too good to carry on over football.
All good. I'll add it.

It's not actually much work at all to add it to this data set, and no extra work to add it for the games after.

I'll add "runs inside 25" just so it stands out from the ones at the other end.
 

BurgoShark

Super Moderator
Joined
Apr 8, 2008
Messages
12,868
Reaction score
4,097
Interesting how the data shows in round one what was to come for McInnes and Williams. Those two are the highlight of the sharks season for me.
Very low minutes from both - but yeah. For the most part Williams work rate was top notch and Cam was probably the Sharks PotY.
 

BurgoShark

Super Moderator
Joined
Apr 8, 2008
Messages
12,868
Reaction score
4,097
Here you go @Tatus.

I've adjusted this so that "midfield" = between your own forty and 25m out from the opposition try line. I felt 25 was a better guide because sometimes they will take a run from 25, get tackled 15 out, and then shift from that play.

I'll update the original post, and I'll include this delineation in future.

Thanks for the input :)


1694662383000.png
 

BurgoShark

Super Moderator
Joined
Apr 8, 2008
Messages
12,868
Reaction score
4,097
Mate you can't try and hide your laziness behind a "but"!

In all seriousness thanks for taking the time and effort to show all this. It's not everyone's cup of tea but for those of us that like stats for more than Fantasy League this stuff is great.
It actually took a lot for me to use that stat. I trust them on tackles but I hate the way they record missed tackles. I'll probably end up revising that...

According to nrl.com:

Player runs sideways; defender chases hard, runs him in to a dead end, dives and misses him as 2 other guys get him = 1 miss.
Ruck defence shits the bed and winger is left defending a 3 on 1. He dives at the eventual try-scorer in desperation = 1 miss.
Defender doesn't move up and throws out a lazy arm as a guy runs past him to score = 1 miss.
 
Top