Sparkles
Jaws
- Joined
- May 21, 2008
- Messages
- 12,187
- Reaction score
- 2,926
That'd be pretty cool mateSo something like this? Add extra columns or dots for "this game, 2023 average, 2024 average"?
Can mock something up later today.
View attachment 30250
That'd be pretty cool mateSo something like this? Add extra columns or dots for "this game, 2023 average, 2024 average"?
Can mock something up later today.
View attachment 30250
It makes for a fairly busy graph. How about if I do something like this?That'd be pretty cool mate

I reckon that works. The really interesting part is probably more so the individual player graphs rhat show week on week change over the roundsIt makes for a fairly busy graph. How about if I do something like this?
2023 & 2024 averages are always there but kinda faded into the background. Big blue dots accentuate the current game, but for anyone who is interested the averages are available.
View attachment 30261
It’s easy enough to generate those week to week - but they’d just get lost. I’d either have to post every player in one thread and it would just be a whole bunch of noise, or each player in their own thread and it would get buried several pages deep.I reckon that works. The really interesting part is probably more so the individual player graphs rhat show week on week change over the rounds
Putting together a new (improved) template for 2024. I’m planning on doing the games week to week instead of waiting until the end of the year - so you should see a game summary each week.
Just like the players, I’ll use the trial games get my game in order. I’m open to suggestions for what people would like to see included. Gotta get in before round 1 though.
Current plan is to include the data from the 2023 game charts, plus add…
- attack BiP vs metres graph like I’ve done in BHU and Toby threads
- error locations like I’ve done above for Teig
- middle forward rotations with errors/penalties like I’ve done in the Toby and Cam threads
Get your requests in now so I can tweak it as needed during the trials…

 .
.Will have to get Chad onto itOh, I like this.
A good old “rugby league week game review”. I miss those.
Hope to get a blow by blow weekly blurb on the game to go along with the stats thou Burgo.
Surely you have nothing better to do with all of your time!
Don’t forget to send all those scouting videos to Fitz either.
The one you shared must surely be with Fitz by now
")
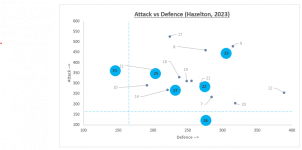
Could you do a chart like this for each round of the season? My release-ready mock-up shows Kaufusi's movement for round 1,2 and 3. In this scenario, Kaufufi's attacking rating is climbing each round. The tool I use for work has a similar report, where the biggest dot (in this case) is the latest round and the others are little dots so you can see the direction the player is moving.It’s easy enough to generate those week to week - but they’d just get lost. I’d either have to post every player in one thread and it would just be a whole bunch of noise, or each player in their own thread and it would get buried several pages deep.
One way would be to just edit post#1 for each player - which my super powers allow me to do. Will just need to let everyone who currently has post #1 in each thread what is going on so they don’t think I’m fiddling with their posts all the time (people get modified with mods edit their posts, and there are already enough idiots on here who like to have cheap shots at mods when this happens).
… or I could start a new thread for every single player so my post is #1, and archive all of the old ones.
I'm hoping it sort of shows my thinking around your data and how I could apply it to SC. Your chart shows (to me, anyway) Williams should have more attacking upside over Rudolf and had steadily increased his minutes, improving his PPM in the process. That's the holy grail really, identifying that player as he shows the trend upward or the potential so you can grab him if he gets a chance at more minutes. If I saw Williams was to get 60 minutes a game he'd almost be my first picked based on all of this. 
I could do a graph like that, but it ends up a bit like spaghetti because it would be very rare for a player to consistently trend up.Could you do a chart like this for each round of the season? My release-ready mock-up shows Kaufusi's movement for round 1,2 and 3. In this scenario, Kaufufi's attacking rating is climbing each round. The tool I use for work has a similar report, where the biggest dot (in this case) is the latest round and the others are little dots so you can see the direction the player is moving.
The only other thing I'd need cross-referenced then is minutes played per round.
Thought I'd try to apply some of this info to SC:
I had a quick look on SC for player costs against their position on the chart. Rudolf and Williams are around the same price ($436k vs $480k). I thought Williams should have been higher base on the chart. A look at Rudolf's SC scores each round shows he had a couple of price-positive games (68, 74 and 43) near the end of the season (off a pretty average 51pt average in the opening 5 rounds), lifting his price after a block of poor scores. He's currently almost smack on his 2023 starting value.
Williams gained almost $200k over the season (which I rode all the way to the bank, thanks Jacky boy!). He was getting more minutes per game in the second half of the season and pulling some 1.8 pt/minutes games out, which was where the price rise came from.
I don't know if that means anything to you in the scheme of things
For trades, I think the strategy is to look at the first 4-5 weeks as one block, then up to the first bye/Origin as another block, Origin, second bye, etc. The first five weeks you want to minimise trades while reshuffling only where necessary. That's where the trending players are gold. You get the price rises without messy and wasteful trading back and forth (so many SC's throw away trades chasing points only to miss the boat or trade out a player who was due a bounce back to form). Again, not sure if that sparks a cunning Burgo-idea around presenting data for SC
Now just need that for every player in the comp. Cheers
View attachment 30266


String theoryI could do a graph like that, but it ends up a bit like spaghetti because it would be very rare for a player to consistently trend up.
This is just for one player.
View attachment 30281
This could work, maybe as stacked bars? That gives an easy view of total involvement levels but with the breakdown. Would trendlines work in there for attack and defence or does that get too messy? That with the minutes below could be it!... but you are probably only talking the overall output night. You don't need a comparison on a quadrant necessarily.
Could do something like either of these quite easily, but it just means "minutes" is going to be a separate graph. The reason I use the quadrant is to give context to high-minute and low-minute performances.
View attachment 30273
View attachment 30275


In that case, a comparison between the players of time spent on attack would also be useful. i.e. who is getting more opportunity to pimp their attacking stats?I guess from SC/Fantasy perspective the top of the graph being higher is likely more important than the sum of its parts.
From specifically SC perspective that’s great but actual good scores come from attacking stats. I guess more runs = more chance of attacking stats, so for that reason attack should be the bottom one

Yeah that could be relevant, especially for a tackle buster.In that case, a comparison between the players of time spent on attack would also be useful. i.e. who is getting more opportunity to pimp their attacking stats?
View attachment 30286
Yep, for sure. The stacked graph is good because the defensive work is part of their base scoring and the attack is really where the opportunity is, but you need both reallyIn that case, a comparison between the players of time spent on attack would also be useful. i.e. who is getting more opportunity to pimp their attacking stats?
View attachment 30286
If I win Powerball tonight I’ll quit my job and get on it.Now just need that for every player in the comp. Cheers
Good luck. To us.If I win Powerball tonight I’ll quit my job and get on it.


Way to stack those stats!@Sparkles I was looking at ways of having averages included in the attacking output graph, and thought something like this might work.
The semi-transparent blue represents the "ghost" of their season average. i.e. if you can see the blue, they haven't reached it. If it is not visible they are above their average.
i.e. this would be an at or above average game for everyone except Mulitalo, Nikora, Brailey, Rudolf, Finucane and Graham.
View attachment 30289
Here's an example where I set everyone's average to Colquhoun's.
View attachment 30291
Can't do a trendline on that one because it's several unique pieces of data. Nikora does not trend in to Williams. Could do it for an individual player, but only for the total.Way to stack those stats!
I think this clearly shows where the squad is at. The one thing I'd have on the wishlist is to be able to see how far above their avg they were... Though if you were doing this per player and the horizontal was replaced by round, then I guess you'd have a good idea.. or could add that trendline?