And yet https://www.sharks.com.au/news/2023/09/22/two-young-sharks-to-take-on-junior-kumuls/Can't do a trendline on that one because it's several unique pieces of data. Nikora does not trend in to Williams. Could do it for an individual player, but only for the total.
You can actually already see how far above their average they are on the normal quadrant (once I include averages).
These two numbers are the same (top of the stack and the Y axis in the quadrant). i.e. Kaufusi's average is about 250 and in this game he was about 300.
View attachment 30292
Remember that the purpose of this one isn't to show you the player's output. It's to show you how the got there.
i.e. why did Royce Hunt pump out so many metres in round 24? Well, because he had a ridiculous amount of kick returns.
Kick returns are hard yards, and it's a great contribution, but it's not a very repeatable stat. In the context of SC there would be no sense in rushing out to add Royce to your team for round 25 because the chances of the team receiving so many kick-offs again during his short stint would be very slim BUT it does tell me that if they contribute equally in terms of overall work, Royce is more likely to have more 8m+ runs than Jesse.
View attachment 30294
You are using an out of date browser. It may not display this or other websites correctly.
You should upgrade or use an alternative browser.
You should upgrade or use an alternative browser.
Western Sharkie
Jaws
You’ve been sweating on that one for a while bort ……


D
Deleted member 2543
Guest
@Sparkles I’m a little torn now mate.
I had planned to invest some time in to expanding the info that I present each week for Sharks players/games, but all of this talk of trends and comparisons has me thinking on a bit bigger scale…
The power in what I do is the ball in play and individualised possession stats. That doesn’t exist anywhere else (that we know of or have access to).
If I was to drop the detail that I added last year (run locations etc.) and automate stat collection from nrl/fox it might actually be possible to track this for the entire NRL by just doing a single re-watch of each game. That may not be doable week-to-week, but I might be able to hover around 1-3 weeks behind the schedule and catch back up in the major bye weeks.
I’m going to do some testing of AI/scraping tools over the next couple of days, and also do a re-watch of one non-Sharks game to see how long it takes to just record possession/BiP and nothing else. That should I give me an idea of what I would be up against if I want to start tracking the league.
Sparkles
Jaws
- Joined
- May 21, 2008
- Messages
- 14,188
- Reaction score
- 4,993
I almost got you across the line@Sparkles I’m a little torn now mate.
I had planned to invest some time in to expanding the info that I present each week for Sharks players/games, but all of this talk of trends and comparisons has me thinking on a bit bigger scale…
The power in what I do is the ball in play and individualised possession stats. That doesn’t exist anywhere else (that we know of or have access to).
If I was to drop the detail that I added last year (run locations etc.) and automate stat collection from nrl/fox it might actually be possible to track this for the entire NRL by just doing a single re-watch of each game. That may not be doable week-to-week, but I might be able to hover around 1-3 weeks behind the schedule and catch back up in the major bye weeks.
I’m going to do some testing of AI/scraping tools over the next couple of days, and also do a re-watch of one non-Sharks game to see how long it takes to just record possession/BiP and nothing else. That should I give me an idea of what I would be up against if I want to start tracking the league.

For sure, it would be a different perspective and serious SC players are total data whores, they'd eat it up. They already pay for SC Gold and the SC Bible. You could potentially have a focus game each round, say, where you pick a match that has big SC implications. That'd be a great headline for the report you're creating
D
Deleted member 2543
Guest
Here you go.I almost got you across the line
For sure, it would be a different perspective and serious SC players are total data whores, they'd eat it up. They already pay for SC Gold and the SC Bible. You could potentially have a focus game each round, say, where you pick a match that has big SC implications. That'd be a great headline for the report you're creating
Test run was 2016 GF
")
Basically it's a single re-watch at normal speed. Lose some time for intricate subs, but gain some by skipping the replays and dead space.
Doing it this way would boil it down to 3 pieces of information:
1) Running Metres vs Attacking Ball in Play
This tells you where a player sits for metre-eating against his peers.
If we mapped this against a single player's season, it would show us how he is sitting against his own average.

2) Tackles vs Defensive Ball in Play
Same as above, but for defence.

3) Simplified model for Attack vs Defence.
- Attack value here is how many metres this player would have run if they played at the same rate for 80 minutes with 50% possession
- Defensive value here is how many tackles this player would have made if they played at the same rate for 80 minutes with 50% possession
Bigger bubble = more minutes played.
In a SC context something like this tells me that while his stats this game may not reflect it because of high possession against, Jesse Bromwich would be the the most likely of all of these players to have a high output in both attack and defence most weeks - because the rate at which he does things is higher than most players and he plays a lot of minutes.
It also tells me that Bukuya, Hieghno and Kenny Bromwich are defensive workhorses, and that both Welch and Taga were high involvement but low-minute players (Taga in particular did very little defence but had heavy attacking involevment).
It also says that Jordan McLean might be ready to push for more minutes (which 20-20 hindsight tells us was indeed the case).

D
Deleted member 2543
Guest
In fact - just the model might be enough for SC.
You are less concerned with what a player DID than it’s what a player COULD DO. That’s what the model can tell you.
… and before you ask - yes - I can probably figure out a way to have different colour bubbles for each team. I just haven’t looked in to that yet.
You are less concerned with what a player DID than it’s what a player COULD DO. That’s what the model can tell you.
… and before you ask - yes - I can probably figure out a way to have different colour bubbles for each team. I just haven’t looked in to that yet.
Not SC (well not that I know how to find) but you can pull their fantasy stats from this game from the NRL website
Fifita 97 (try)
J Brom 81 (try)
Gallen 47
K Brom 43
Prior 41
Finucane 39
McLean 35
Bukuya 33
Glasby 29
Heighington 26
Welch 14
Tagataese 10
Semi-related to what you say with McLean one of the big tricks in SC is correctly identifying how a team will react to an injury.
If a prop goes down for an extended period will his 40 minutes of +30 to one bloke and +10 to another? Or will they go +10 to four blokes?
Can sometimes get a bit of extra confidence if they go to a 3 forward bench instead of 4.
A bloke who can maintain a workrate going up from like 15 minutes to say, 40, can be a good cash gainer.
Then back to comparing the scores to the workrate you've tabled: a guy who consistently scores above predicted by workrate is probably getting solid attacking stats, in which case potential extra minutes for him could have escalated value. A guy who is all base stats getting extra minutes might not be likely to go up by enough to warrant a trade.
Is there a way to incorporate a 'expected base stat' SC score in the background of the model, so you could compare real score to where the model sits them?
Proud Shark
Jaws
- Joined
- Feb 3, 2015
- Messages
- 11,615
- Reaction score
- 6,448
The other thing for SC is that work rate is secondary to minutes in most cases. If a forward plays 80m and makes 40 tackles + 10 hit ups over 8m. That's worth well more to me than the guy who made 30 tackles and 8 hit ups over 8m in 30 minutes.
Sparkles
Jaws
- Joined
- May 21, 2008
- Messages
- 14,188
- Reaction score
- 4,993
A bit more to Borts excellent post above:
@BurgoShark I've checked out the tool below. It looks like it'll probably work but I've only had a quick look so far (you need to install software for the free version and I'm not game to run it at the office) . I'm not sure that the free plan has enough juice to capture all of the players.
I pointed it at https://supercoach.dailytelegraph.com.au/nrl/classic/past-stats;season=2023 . You'd then point it at https://supercoach.dailytelegraph.com.au/nrl/classic/players from the start of the season and run a scrape following each round (once updates are finalised).
 www.octoparse.com
Yes... Jesse score would likely have been low and his price dropped... meaning he'd be a trade target. Especially if you could see that has happened across a few of his last games. That temporary dip in form/minutes/attacking stats is gold.In a SC context something like this tells me that while his stats this game may not reflect it because of high possession against, Jesse Bromwich would be the the most likely of all of these players to have a high output in both attack and defence most weeks - because the rate at which he does things is higher than most players and he plays a lot of minutes.
This one's interesting. Some players PPM (points per minute) don't always hold up with bigger minutes, making them a bit of a trap. The stats SC'ers look at PPM in games where they've played bigger minutes historically to see if there's value or not.It also tells me that Bukuya, Hieghno and Kenny Bromwich are defensive workhorses, and that both Welch and Taga were high involvement but low-minute players (Taga in particular did very little defence but had heavy attacking involevment).
This is where scraping the SC site each week would be very handy. Or even the page with the last years figures.Is there a way to incorporate a 'expected base stat' SC score in the background of the model, so you could compare real score to where the model sits them?
@BurgoShark I've checked out the tool below. It looks like it'll probably work but I've only had a quick look so far (you need to install software for the free version and I'm not game to run it at the office
) . I'm not sure that the free plan has enough juice to capture all of the players. I pointed it at https://supercoach.dailytelegraph.com.au/nrl/classic/past-stats;season=2023 . You'd then point it at https://supercoach.dailytelegraph.com.au/nrl/classic/players from the start of the season and run a scrape following each round (once updates are finalised).
Web Scraping Tool & Free Web Crawlers | Octoparse
D
Deleted member 2543
Guest
It's important to make a distinction here that I'm not trying to develop a model for SC.Is there a way to incorporate a 'expected base stat' SC score in the background of the model, so you could compare real score to where the model sits them?
It's a model which measures actual player out, but I'm taking input here on how the info can be presented to also help SC punters.
I had a look at some scraping tools earlier today, but it turns out that nrl.com stats you can pretty much just get in excel with a copy/paste and a bit of a tidy up.@BurgoShark I've checked out the tool below. It looks like it'll probably work but I've only had a quick look so far (you need to install software for the free version and I'm not game to run it at the office
Ball in Play though... that's always manual.
So this tells me that the dataset you want is the same as above, but you want a different focus. You are more interested in attack vs minutes, and defence as a secondary metric.The other thing for SC is that work rate is secondary to minutes in most cases. If a forward plays 80m and makes 40 tackles + 10 hit ups over 8m. That's worth well more to me than the guy who made 30 tackles and 8 hit ups over 8m in 30 minutes.
Below is the same data, but I've swapped the x-axis and the bubble (smaller bubble means they make less tackles per minute).

Last edited by a moderator:
Sparkles
Jaws
- Joined
- May 21, 2008
- Messages
- 14,188
- Reaction score
- 4,993
And just as important to acknowledge that we're attempting to turn you towards making a model for SC to give us even a .005% edge over the competitionIt's important to make a distinction here that I'm not trying to develop a model for SC.
D
Deleted member 2543
Guest
AcknowledgedAnd just as important to acknowledge that we're attempting to turn you towards making a model for SC to give us even a .005% edge over the competition
Proud Shark
Jaws
- Joined
- Feb 3, 2015
- Messages
- 11,615
- Reaction score
- 6,448
The data set I want is based on SC points. They give points for both attack and defence.So this tells me that the dataset you want is the same as above, but you want a different focus. You are more interested in attack vs minutes, and defence as a secondary metric.
Below is the same data, but I've swapped the x-axis and the bubble (smaller bubble means they make less tackles per minute).
View attachment 30311
I think Sparkles nailed it in suggesting that your model could identify when a player is underscoring through no fault of their own, ie less ball in play/ball in hand time.
Generally, I look at the points per minute that a player generates, and then try to determine the consistency of their minutes when looking for value players. E.g Haas gets injured long term, so Carrigan is likely to see increased minutes.
In SC the safer players have good base scoring, particularly for forwards. Which is from hit ups over 8m (2) hit ups (1), and tackles (1).
From there, you look for attacking upside. Whether they offload (4/2), bust tackles (2), generate linbreaks (10) or line break assists (8). Tries (17) and try assists (12) are important too, particularly for the players with lower base.
I'm not sure if that's helpful, but you're not necessarily looking for attack or defence, just points. 40 tackles = to 20 hit ups over 8m = one linebreak try + goal kick (4) with a few tackle busts thrown in.
Lots of rambling here, but it might be worth modeling SC scores against ball in play/ball in hand time, alongside how many tackles/runs they make.
*Obviously this is only in reference to making it SC relevant, the rest of your work is awesome.
Sparkles
Jaws
- Joined
- May 21, 2008
- Messages
- 14,188
- Reaction score
- 4,993
Nice summary. I think even I understood it.The data set I want is based on SC points. They give points for both attack and defence.
I think Sparkles nailed it in suggesting that your model could identify when a player is underscoring through no fault of their own, ie less ball in play/ball in hand time.
Generally, I look at the points per minute that a player generates, and then try to determine the consistency of their minutes when looking for value players. E.g Haas gets injured long term, so Carrigan is likely to see increased minutes.
In SC the safer players have good base scoring, particularly for forwards. Which is from hit ups over 8m (2) hit ups (1), and tackles (1).
From there, you look for attacking upside. Whether they offload (4/2), bust tackles (2), generate linbreaks (10) or line break assists (8). Tries (17) and try assists (12) are important too, particularly for the players with lower base.
I'm not sure if that's helpful, but you're not necessarily looking for attack or defence, just points. 40 tackles = to 20 hit ups over 8m = one linebreak try + goal kick (4) with a few tackle busts thrown in.
Lots of rambling here, but it might be worth modeling SC scores against ball in play/ball in hand time, alongside how many tackles/runs they make.
*Obviously this is only in reference to making it SC relevant, the rest of your work is awesome.
One thing to add (though I think both said it earlier) is that you do look for players with a solid, consistent 'base', usually made up of the boring stuff that earns you a whipping boy tag - like those 8m hit-ups and lots of tackles. Offloads are gold, as are line breaks and try assists. Ideally, you diacover a player capable of busting a tackle or two, offloading, backing up the play and throwing a cut out pass to a winger (that's also in your team). Then kicking the conversion.
D
Deleted member 2543
Guest
Is there a summary of this after each game which just presents it as "attack points" and "defence points", or would someone need to add up each of the columns to figure out where the points came from?The data set I want is based on SC points. They give points for both attack and defence.
This is kinda the whole point of collecting/presenting the data in the first place. I got sick of the fan/commentator fixation with metres indicating player performance... or probably more correctly... that more metres = a better performance / less metres = a lazy performance.I think Sparkles nailed it in suggesting that your model could identify when a player is underscoring through no fault of their own, ie less ball in play/ball in hand time.
I think I've made a pretty compelling case that ball in hand time (nice - I'm stealing that) is the single-biggest factor in how many runs and metres a player will have. When you factor this in there is little difference between the subjectively best players and the subjectively just OK players.
It seems SC players have already figured this out where it is relevant to SC. As you said above, minutes is more important than actual work rate... so what you are looking for is a high work-rate player with potential to have his minutes increase (for any number of reasons).
Generally, I look at the points per minute that a player generates, and then try to determine the consistency of their minutes when looking for value players. E.g Haas gets injured long term, so Carrigan is likely to see increased minutes.
Where can you find a player's base? Is this recorded somewhere?In SC the safer players have good base scoring, particularly for forwards. Which is from hit ups over 8m (2) hit ups (1), and tackles (1).
From there, you look for attacking upside. Whether they offload (4/2), bust tackles (2), generate linbreaks (10) or line break assists (8). Tries (17) and try assists (12) are important too, particularly for the players with lower base.
That wouldn't be too much work under this format as long as the base/attack/defence scores are available without having to be calculated.I'm not sure if that's helpful, but you're not necessarily looking for attack or defence, just points. 40 tackles = to 20 hit ups over 8m = one linebreak try + goal kick (4) with a few tackle busts thrown in.
Lots of rambling here, but it might be worth modeling SC scores against ball in play/ball in hand time, alongside how many tackles/runs they make.
*Obviously this is only in reference to making it SC relevant, the rest of your work is awesome.
Where can you find a player's base? Is this recorded somewhere?
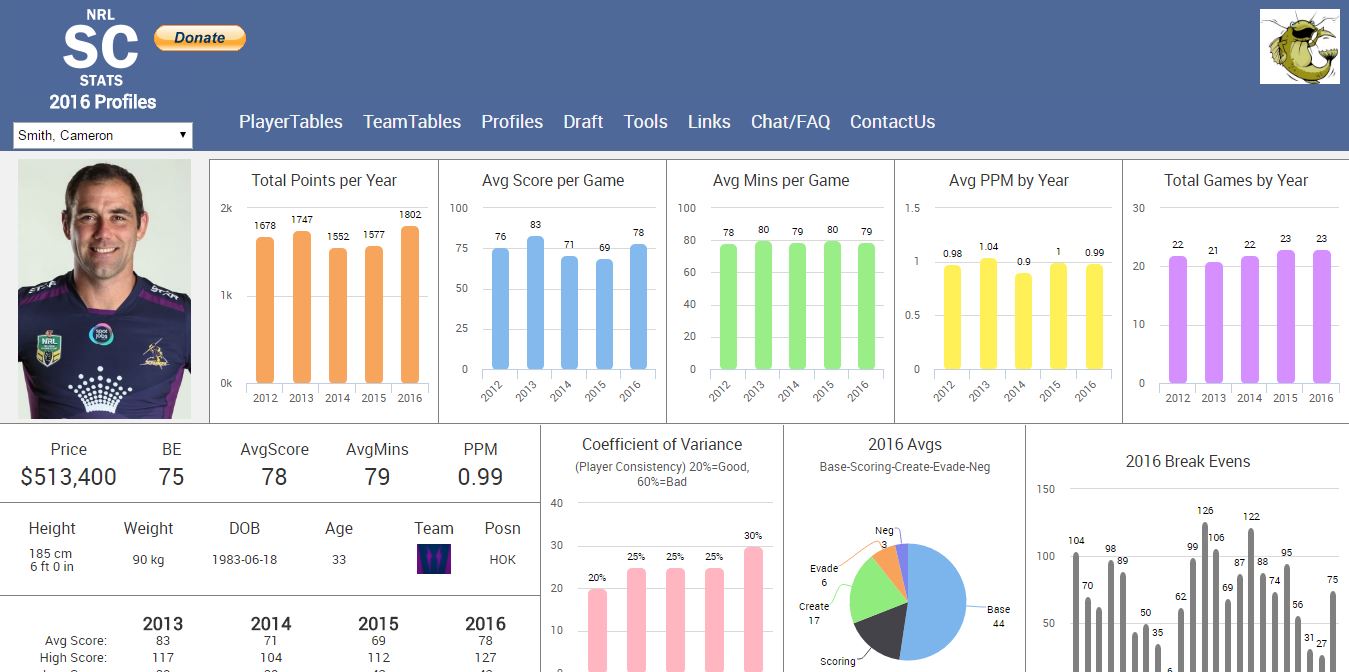
You can kind of find a stats breakdown here: https://www.nrlsupercoachstats.com/
No stats in yet but if you scroll down to 2024 Draw you have
Pts (points)
Min (minutes)
Bse (base)
Scr (scoring)
Cre (creative)
Evd (evading...?)
Neg (negative)
Then price, Break Even and Points Per Minute
So you don't have how they came to the base - tackles or runs, just the total.
Actually you can pull up the old stats https://www.nrlsupercoachstats.com/index.php?year=2023
D
Deleted member 2543
Guest
That is player by player though right?You can kind of find a stats breakdown here: https://www.nrlsupercoachstats.com/
No stats in yet but if you scroll down to 2024 Draw you have
Pts (points)
Min (minutes)
Bse (base)
Scr (scoring)
Cre (creative)
Evd (evading...?)
Neg (negative)
Then price, Break Even and Points Per Minute
So you don't have how they came to the base - tackles or runs, just the total.
Actually you can pull up the old stats https://www.nrlsupercoachstats.com/index.php?year=2023
Can I see from any one game what all players bases are versus points scored?
Proud Shark
Jaws
- Joined
- Feb 3, 2015
- Messages
- 11,615
- Reaction score
- 6,448
There isn't any separation into attack and defence points that I know of.Is there a summary of this after each game which just presents it as "attack points" and "defence points", or would someone need to add up each of the columns to figure out where the points came from?
Agreed on all fronts.This is kinda the whole point of collecting/presenting the data in the first place. I got sick of the fan/commentator fixation with metres indicating player performance... or probably more correctly... that more metres = a better performance / less metres = a lazy performance.
I think I've made a pretty compelling case that ball in hand time (nice - I'm stealing that) is the single-biggest factor in how many runs and metres a player will have. When you factor this in there is little difference between the subjectively best players and the subjectively just OK players.
Where can you find a player's base? Is this recorded somewhere?
That wouldn't be too much work under this format as long as the base/attack/defence scores are available without having to be calculated.
NRL Supercoach Stats - 2023 Player Profile
2023 Player Profile on nrlsupercoachstats.com Scores, Averages, Minutes and PPMs. Sort and filter lists based on player name, position or round. View totals and stats for each round.
This is the best site I know of. You don't get attack v defence, but they break it up into base, scoring, creating, evading, and negative plays
Base covers tackles and hit ups.
Scoring is tries and goals.
Creating is try assists, line break assists and forced drop outs.
Evading is line breaks, offloads, tackle busts and kick regather breaks.
Negative is missed tackles, penalties, errors, and kicked dead.
At least that's where I think they all fit.
Proud Shark
Jaws
- Joined
- Feb 3, 2015
- Messages
- 11,615
- Reaction score
- 6,448
Not that I know of.That is player by player though right?
Can I see from any one game what all players bases are versus points scored?
D
Deleted member 2543
Guest
So I’d need to manually enter it for each player and then update it manually round by round?Not that I know of.
Yuck.