2023 NRL Round 26 Newcastle Knights v Cronulla-Sutherland Sharks, 4:05PM Sunday 27th August @ McDonald Jones Stadium

bort

Jaws
Joined
Jun 4, 2007
Messages
30,542
Reaction score
6,355
Location
IN A BAR
Weirdly few (but getting more common) times is the away side worse off. Only one game last year was the away side worse off and still won - before that, within this data, if you were away and had less rest you lose.

2016
Brisbane (8) vs Titans (6) Broncos won 44-28

2017

2018

2019

2020

Penrith (8) vs Roosters (7) Penrith won 29-28

2021
Roosters (9) vs Titans (6) Roosters win 25-24
Parra (9) vs Knights (8) Parra win 28-20

2022
Penrith (8) vs Parra (6) Penrith win 27-8
Melbourne (9) vs Canberra (6) Canberra win 28-20
 
Last edited:

HaroldBishop

Megalodon
Joined
Mar 8, 2012
Messages
55,502
Reaction score
8,374
Location
Sydney
If we win and Brisbane beast Canberra we can't finish lower than 5th.

Maybe we rest some players from the last game?
Got me curious as to what our turn arounds were vs the perceived big clubs (Melbourne, Broncos, Roosters, Souths, Penrith), but ended up including all teams from each finals series.

2016
Sharks (7) Vs Canberra (8) Sharks Won 16-14
Brisbane (8) vs Titans (6) Broncos won 44-28
Melbourne (7) vs Cowboys (7) Melbourne won 16-10
Penrith (7) vs Dogs (9) Penrith win 28-12

2017
Sharks (7) Vs Cowboys (10) Sharks Lost 15-14
Roosters (6) Vs Brisbane (8) Roosters won 24-22
Melbourne (7) vs Parra (8) Melbourne win 18-16
Manly (7) vs Penrith (7) Penrith win 22-10

2018
Sharks (6) Vs Roosters (7) Sharks Lost 21-12
Melbourne (7) vs Souths (8) Melbourne win 29-28
Penrith (8) vs NZ (8) Penrith win 27-12
Brisbane (7) vs Saints (8) Saints win 48-18

2019
Sharks (6) Vs Manly (8) Lost 28-16
Roosters (8) vs Souths (8) Roosters win 30-6
Melbourne (8) vs Canberra (7) Canberra win 12-10
Parra (9) vs Brisbane (8) Parra win 58-0

2020
Sharks (7) vs Canberra (7) Lost 32-30
Penrith (8) vs Roosters (7) Penrith won 29-28
Melbourne (6) v Parra (7) Melbourne win 36-24
Souths (9) vs Knights (9) Souths win 46-20

2021
Melbourne (7) vs Manly (8) Melbourne win 40-12
Roosters (9) vs Titans (6) Roosters win 25-24
Penrith (6) vs Souths (7) Souths win 16-10
Parra (9) vs Knights (8) Parra win 28-20

2022
Sharks (6) vs Cowboys (7) Sharks lost 32-30
Penrith (8) vs Parra (6) Penrith win 27-8
Melbourne (9) vs Canberra (6) Canberra win 28-20
Roosters (9) vs Souths (9) Souths win 30-14

Some very interesting takeaways from looking at this. Of the 6 day turn arounds leading into a finals game: Titans lost 2016, Roosters won 2017, Storm won 2020, Titans and Penrith lost 2021, Canberra won 2022, Sharks and Parra lost. So of the 8 games since 2016 where teams have come off the back of a 6-day turnaround, only 3 have won.

The biggest takeaway for me is that in the last 7 years, we've played finals 6 times and in 5 of those matches our opponent has had a longer rest than us.

Below I looked at each team's average turnaround and average opposition turnaround since 2016.

Team (appearances)Average Finals Turnaround (days)Opposition Turnaround (days)Average Advantage (days)
Sharks (6)6.57.8- 1.3
Penrith (6)7.37.30
Broncos (4)7.757.25+ 0.5
Souths (5)8.27.8+ 0.4
Roosters (6)7.77.5+ 0.2
Storm (7)7.37.30
Manly (3)7.76.7+ 1
Cowboys (3)86.7+ 1.3
Parra (5)7.87.4+ 0.4
Knights (2)8.59- 0.5
Titans (2)68.5- 2.5
Bulldogs (1)97+ 2
NZ (1)880
Saints (1)87+ 1

We are the only side in negative with enough data to say we've probably been slightly dicked. Titans got massively screwed in their two appearances as well, however. Take what you want from the above, but keep in mind that our game v the cowboys where they had 3 extra days will skew both ours and their average.

I couldn't be bothered looking at all teams further back from 2016, but I just looked at Cronulla.

2015 - Sharks (7) v Souths (9)
2013 - Sharks (6) v Cowboys (7)
2012 - Sharks (7) v Canberra (7)
2008 - Sharks (7) v Canberra (6)
2005 - Sharks (7) v Saints (6)

2002 - Sharks (6) v Roosters (6)
2001 - Sharks (5) v Brisbane (6)
2000 - Sharks (7) v Brisbane (9)
1999 - Sharks (8) v Brisbane (9)

Add these to the above data set and over 15 appearances we average:
- 6.6 days turnaround
- 7.5 days opposition turnaround for a -0.9 day advantage. I think that's enough data to say we've been dicked. We've had an advantage in 2/15 games and had a disadvantage in 10/15 games.
Thanks Burgo
 

BurgoShark

Super Moderator
Joined
Apr 8, 2008
Messages
12,868
Reaction score
4,097
Got me curious as to what our turn arounds were vs the perceived big clubs (Melbourne, Broncos, Roosters, Souths, Penrith), but ended up including all teams from each finals series.

2016
Sharks (7) Vs Canberra (8) Sharks Won 16-14
Brisbane (8) vs Titans (6) Broncos won 44-28
Melbourne (7) vs Cowboys (7) Melbourne won 16-10
Penrith (7) vs Dogs (9) Penrith win 28-12

2017
Sharks (7) Vs Cowboys (10) Sharks Lost 15-14
Roosters (6) Vs Brisbane (8) Roosters won 24-22
Melbourne (7) vs Parra (8) Melbourne win 18-16
Manly (7) vs Penrith (7) Penrith win 22-10

2018
Sharks (6) Vs Roosters (7) Sharks Lost 21-12
Melbourne (7) vs Souths (8) Melbourne win 29-28
Penrith (8) vs NZ (8) Penrith win 27-12
Brisbane (7) vs Saints (8) Saints win 48-18

2019
Sharks (6) Vs Manly (8) Lost 28-16
Roosters (8) vs Souths (8) Roosters win 30-6
Melbourne (8) vs Canberra (7) Canberra win 12-10
Parra (9) vs Brisbane (8) Parra win 58-0

2020
Sharks (7) vs Canberra (7) Lost 32-30
Penrith (8) vs Roosters (7) Penrith won 29-28
Melbourne (6) v Parra (7) Melbourne win 36-24
Souths (9) vs Knights (9) Souths win 46-20

2021
Melbourne (7) vs Manly (8) Melbourne win 40-12
Roosters (9) vs Titans (6) Roosters win 25-24
Penrith (6) vs Souths (7) Souths win 16-10
Parra (9) vs Knights (8) Parra win 28-20

2022
Sharks (6) vs Cowboys (7) Sharks lost 32-30
Penrith (8) vs Parra (6) Penrith win 27-8
Melbourne (9) vs Canberra (6) Canberra win 28-20
Roosters (9) vs Souths (9) Souths win 30-14

Some very interesting takeaways from looking at this. Of the 6 day turn arounds leading into a finals game: Titans lost 2016, Roosters won 2017, Storm won 2020, Titans and Penrith lost 2021, Canberra won 2022, Sharks and Parra lost. So of the 8 games since 2016 where teams have come off the back of a 6-day turnaround, only 3 have won.

The biggest takeaway for me is that in the last 7 years, we've played finals 6 times and in 5 of those matches our opponent has had a longer rest than us.

Below I looked at each team's average turnaround and average opposition turnaround since 2016.

Team (appearances)Average Finals Turnaround (days)Opposition Turnaround (days)Average Advantage (days)
Sharks (6)6.57.8- 1.3
Penrith (6)7.37.30
Broncos (4)7.757.25+ 0.5
Souths (5)8.27.8+ 0.4
Roosters (6)7.77.5+ 0.2
Storm (7)7.37.30
Manly (3)7.76.7+ 1
Cowboys (3)86.7+ 1.3
Parra (5)7.87.4+ 0.4
Knights (2)8.59- 0.5
Titans (2)68.5- 2.5
Bulldogs (1)97+ 2
NZ (1)880
Saints (1)87+ 1

We are the only side in negative with enough data to say we've probably been slightly dicked. Titans got massively screwed in their two appearances as well, however. Take what you want from the above, but keep in mind that our game v the cowboys where they had 3 extra days will skew both ours and their average.

I couldn't be bothered looking at all teams further back from 2016, but I just looked at Cronulla.

2015 - Sharks (7) v Souths (9)
2013 - Sharks (6) v Cowboys (7)
2012 - Sharks (7) v Canberra (7)
2008 - Sharks (7) v Canberra (6)
2005 - Sharks (7) v Saints (6)

2002 - Sharks (6) v Roosters (6)
2001 - Sharks (5) v Brisbane (6)
2000 - Sharks (7) v Brisbane (9)
1999 - Sharks (8) v Brisbane (9)

Add these to the above data set and over 15 appearances we average:
- 6.6 days turnaround
- 7.5 days opposition turnaround for a -0.9 day advantage. I think that's enough data to say we've been dicked. We've had an advantage in 2/15 games and had a disadvantage in 10/15 games.
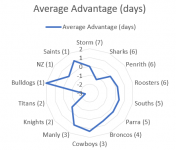
Nice effort! I'd be interested to see if there is a correlation between short turnarounds and finals losses.

Here is your "advantage" column thrown into a radar graph so it looks pretty :)


1692597292009.png
 
Joined
Feb 3, 2015
Messages
8,580
Reaction score
2,879
Nice effort! I'd be interested to see if there is a correlation between short turnarounds and finals losses.

Here is your "advantage" column thrown into a radar graph so it looks pretty :)


View attachment 29313
For the 6 day turnaround, I think it was something like 3/8 or 3/9 teams had won. I hadn't looked at the shorter turn around overall yet.

*Had a look.

Of 21 games since 2016 when a team had a disadvantage in preparation they won 9/21 times.
However, when a team was coming off a 6 day turn around they have only won 3/10 times.

Probably not enough data, but hints at the advantage/disadvantage being less of a factor where both sides were given at least 7 days turnaround.
So given the Sharks have averaged less than 7 days across 15 finals appearances you could say they have been more disadvantaged than other sides.
 
Last edited:

bort

Jaws
Joined
Jun 4, 2007
Messages
30,542
Reaction score
6,355
Location
IN A BAR
For the 6 day turnaround, I think it was something like 3/8 or 3/9 teams had won. I hadn't looked at the shorter turn around overall yet.

*Had a look.

Of 21 games since 2016 when a team had a disadvantage in preparation they won 9/21 times.
However, when a team was coming off a 6 day turn around they have only won 3/10 times.

Probably not enough data, but hints at the advantage/disadvantage being less of a factor where both sides were given at least 7 days turnaround.
So given the Sharks have averaged less than 7 days across 15 finals appearances you could say they have been more disadvantaged than other sides.
Fact a lot of the disadvantages sides are the home side probably helps skew the numbers back towards being balanced (9/21), win rate as the disadvantaged and away side is only 1/6.
 

Sevshark

Great White
Joined
Oct 11, 2021
Messages
3,814
Reaction score
2,603
As long as they don't play Brodie Jones we win.
 

stormshark

Jaws
Joined
Jan 8, 2009
Messages
5,706
Reaction score
469
Location
Phillip Island
Pretty confident we beat The Pointy Heads. Contain them in the first 20, we bring em back to the field. We complete, reduce the missed tackle, Ponga HIA, they fumble bumble after half time hopefully.
 

apezza

Great White
Joined
Apr 1, 2010
Messages
4,710
Reaction score
2,479
Nice effort! I'd be interested to see if there is a correlation between short turnarounds and finals losses.

Here is your "advantage" column thrown into a radar graph so it looks pretty :)


View attachment 29313
I've seen a similar graph for Latrell Mitchell's brain snaps and MIAs against teams in the NRL
 

Up-Up Cronulla

Hammerhead
Joined
Apr 11, 2021
Messages
278
Reaction score
167
So who else besides Ponga is a threat? Marzhew? Best? Gamble? Hastings? (if he plays).

I'm worried about Gamble's energy. He may not be so sklillful but he busts his arse and keeps trying for 80 minutes.
Dom Young goes alright.
 

Wiz

Jaws
Joined
Mar 23, 2016
Messages
5,906
Reaction score
1,514
Tricky and Hynes to show the knights who’s boss
 

Gards

Jaws
Joined
Apr 25, 2010
Messages
18,502
Reaction score
2,128
Location
At the Tucky
Not sure AOB has done much except move Ponga to fullback... you string a few games together, you start playing with confidence.

And all Fitz had to do was move Moylan to the coaches box.

Fact a lot of the disadvantages sides are the home side probably helps skew the numbers back towards being balanced (9/21), win rate as the disadvantaged and away side is only 1/6.

Prob has more to do with all of those home sides being superior teams but I'm not discounting the value of extra rest days at the point end of the season after many many months of week in week our NRL footy

But if a team has a short turn around it could also mean that they had a longer turn around for the game they had in previous round or final

We have three 7+ day turnarounds leading into this years final series. That's pretty handy
 
Last edited:
Top