D
Deleted member 2543
Guest
With the bye coming up I thought I'd look at some team stats and start working on player totals/averages.
I have been tracking errors, penalties and set restarts across the first four rounds. You can see the locations in each of the threads for the rounds.
The main thing to note here is that this does not use nrl.com or fox handling errors stats. It is based on watching every incident and determining what it appropriate. I attribute an error to the player who actually made the mistake rather necessarily the last person to touch it, and for some scenarios where nrl.com would call something error I don't. E.g. player making a tackle has the ball thrown in to his arm (there are several others).
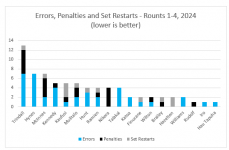
All errors, penalties and set restarts.
First one shows all errors / negative plays as totals. Pretty straight forward.
Error Frequency
Comparing players based on raw numbers is not always fair though, because some guys play 80 and others don't. This is where we can start looking at error frequency. Rather than who is making the most total errors, who is more likely to make an error?
We can look at this from three different ways
- errors in attack
- conceding penalties and six agains
- combined
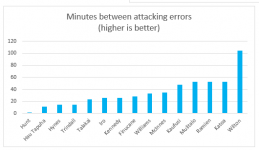
Minutes between attacking errors
This one shows how many minutes each player averages between an error in attack.
This is based on ball in hand.
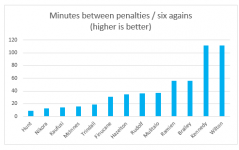
Minutes between penalties / six-agains
This one shows how many minutes each player averages between conceding a penalty or a six again.
This is based on opposition ball in hand.
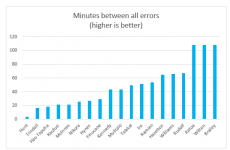
Minutes between making a negative play
This one shows how many minutes each player averages between any negative play (error, penalty or a six again).
This is based on all ball in play.
Attacking Errors from the Most Involved Players
Excluding Brailey (who hasn't made an attacking error this season) a high portion of attacking errors are coming from the players who touch the ball the most (Kennedy, Trindall, Hynes and McInnes). This is somewhat to be expected, because players who do more stuff are likely to have more plays both positive and negative.
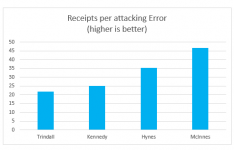
We can add a different scale to compare these guys between each other. Errors per touch.
@bort for this one I am using the nrl.com receipts stat, which I know you have done some work on previously.
* I also had to do some normalisation of McInnes's numbers here to compare them on a per-80 basis.
This in laymen's terms his "how many times will he touch the ball before making an error".
Not really an issue for Cam. Too many errors from the spine players though.
I have been tracking errors, penalties and set restarts across the first four rounds. You can see the locations in each of the threads for the rounds.
The main thing to note here is that this does not use nrl.com or fox handling errors stats. It is based on watching every incident and determining what it appropriate. I attribute an error to the player who actually made the mistake rather necessarily the last person to touch it, and for some scenarios where nrl.com would call something error I don't. E.g. player making a tackle has the ball thrown in to his arm (there are several others).
All errors, penalties and set restarts.
First one shows all errors / negative plays as totals. Pretty straight forward.

Error Frequency
Comparing players based on raw numbers is not always fair though, because some guys play 80 and others don't. This is where we can start looking at error frequency. Rather than who is making the most total errors, who is more likely to make an error?
We can look at this from three different ways
- errors in attack
- conceding penalties and six agains
- combined
Minutes between attacking errors
This one shows how many minutes each player averages between an error in attack.
This is based on ball in hand.

Minutes between penalties / six-agains
This one shows how many minutes each player averages between conceding a penalty or a six again.
This is based on opposition ball in hand.

Minutes between making a negative play
This one shows how many minutes each player averages between any negative play (error, penalty or a six again).
This is based on all ball in play.

Attacking Errors from the Most Involved Players
Excluding Brailey (who hasn't made an attacking error this season) a high portion of attacking errors are coming from the players who touch the ball the most (Kennedy, Trindall, Hynes and McInnes). This is somewhat to be expected, because players who do more stuff are likely to have more plays both positive and negative.
We can add a different scale to compare these guys between each other. Errors per touch.
@bort for this one I am using the nrl.com receipts stat, which I know you have done some work on previously.
* I also had to do some normalisation of McInnes's numbers here to compare them on a per-80 basis.
This in laymen's terms his "how many times will he touch the ball before making an error".
Not really an issue for Cam. Too many errors from the spine players though.

Last edited by a moderator:
